Formulating Multi-Frequency AC Impedance Guardbands to Bound Customs Enforcement Exposure for High-Density Board Assemblies
Formulate multi-frequency AC impedance guardbands by applying asymmetric root-sum-square budgets that absorb moisture uptake and vector de-embedding shifts.

Dock
Border control laboratories intercept high-density printed circuit assemblies when declared technical specifications diverge from physical test readings taken during targeted audits. Customs authorities in North America and the European Union enforce dual-use export limits and tariff classifications through direct laboratory measurement. When a high-speed telecommunications mainboard lands under Harmonized Tariff Schedule heading 8471 or 8517, the import classification often hinges on interface transmission speed.
Assemblies operating beyond specified gigabit thresholds face dual-use licensing under Export Control Classification Number 4A003 or 5A002. Inspectors at container terminal inspection stations pull samples directly from palletized ocean cargo to verify these physical parameters.
Technicians at customs testing facilities cut access windows into vacuum barrier packaging or connect high-frequency microprobes to exposed edge coupons. Characteristic impedance on differential interconnects dictates transmission performance across high-density lines. If a customs laboratory measures 88 ohms on a differential pair declared at 100 ohms with a ten percent tolerance, the declaration fails.
Border agents hold the entire container lot pending administrative review. Cargo stays impounded. Demurrage accumulates while commercial delivery windows close.
Under IPC-6012 Class 3 requirements, failure to meet impedance tolerances across cross-border verification coupons triggers formal shipment detention and mandatory technical reclassification.
Establishing outgoing factory test limits without accounting for customs laboratory measurement variation creates severe border vulnerability. Factory automated test equipment commonly evaluates bare printed circuit coupons at a single frequency of one gigahertz using time-domain reflectometry. Customs screening facilities employ vector network analyzers to record scattering parameters across wide frequency spectra reaching up to 40 gigahertz.
Discrepancies between these test environments expose importers to seizure actions, civil penalties under 19 U.S.C. 1592, and retroactive tariff assessments.

Import Clearance Interceptions
Port inspections focus on high-speed serial links running PCIe Gen 5, DDR5, and 112-gigabit PAM4 Ethernet architectures. National border laboratories verify whether hardware matches the precise technical tier declared on shipping documents. An assembly declared as standard commercial networking gear gets flagged if laboratory characterization reveals channel margins typical of restricted high-performance computing hardware.
Border agents treat a two-ohm negative shift outside declared limits as evidence of undocumented design revisions or fraudulent specification declarations.
Testing on customs docks occurs in uncontrolled ambient facilities where temperature and humidity vary wildly from factory cleanrooms. When test instruments encounter impedance variations induced by ambient moisture or thermal shifts, the official test report logs an outright non-compliance. Importers face the burden of proving that the discrepancy stems from measurement drift rather than illicit hardware substitution.
Port demurrage accrues daily.
Physical Verification at the Port
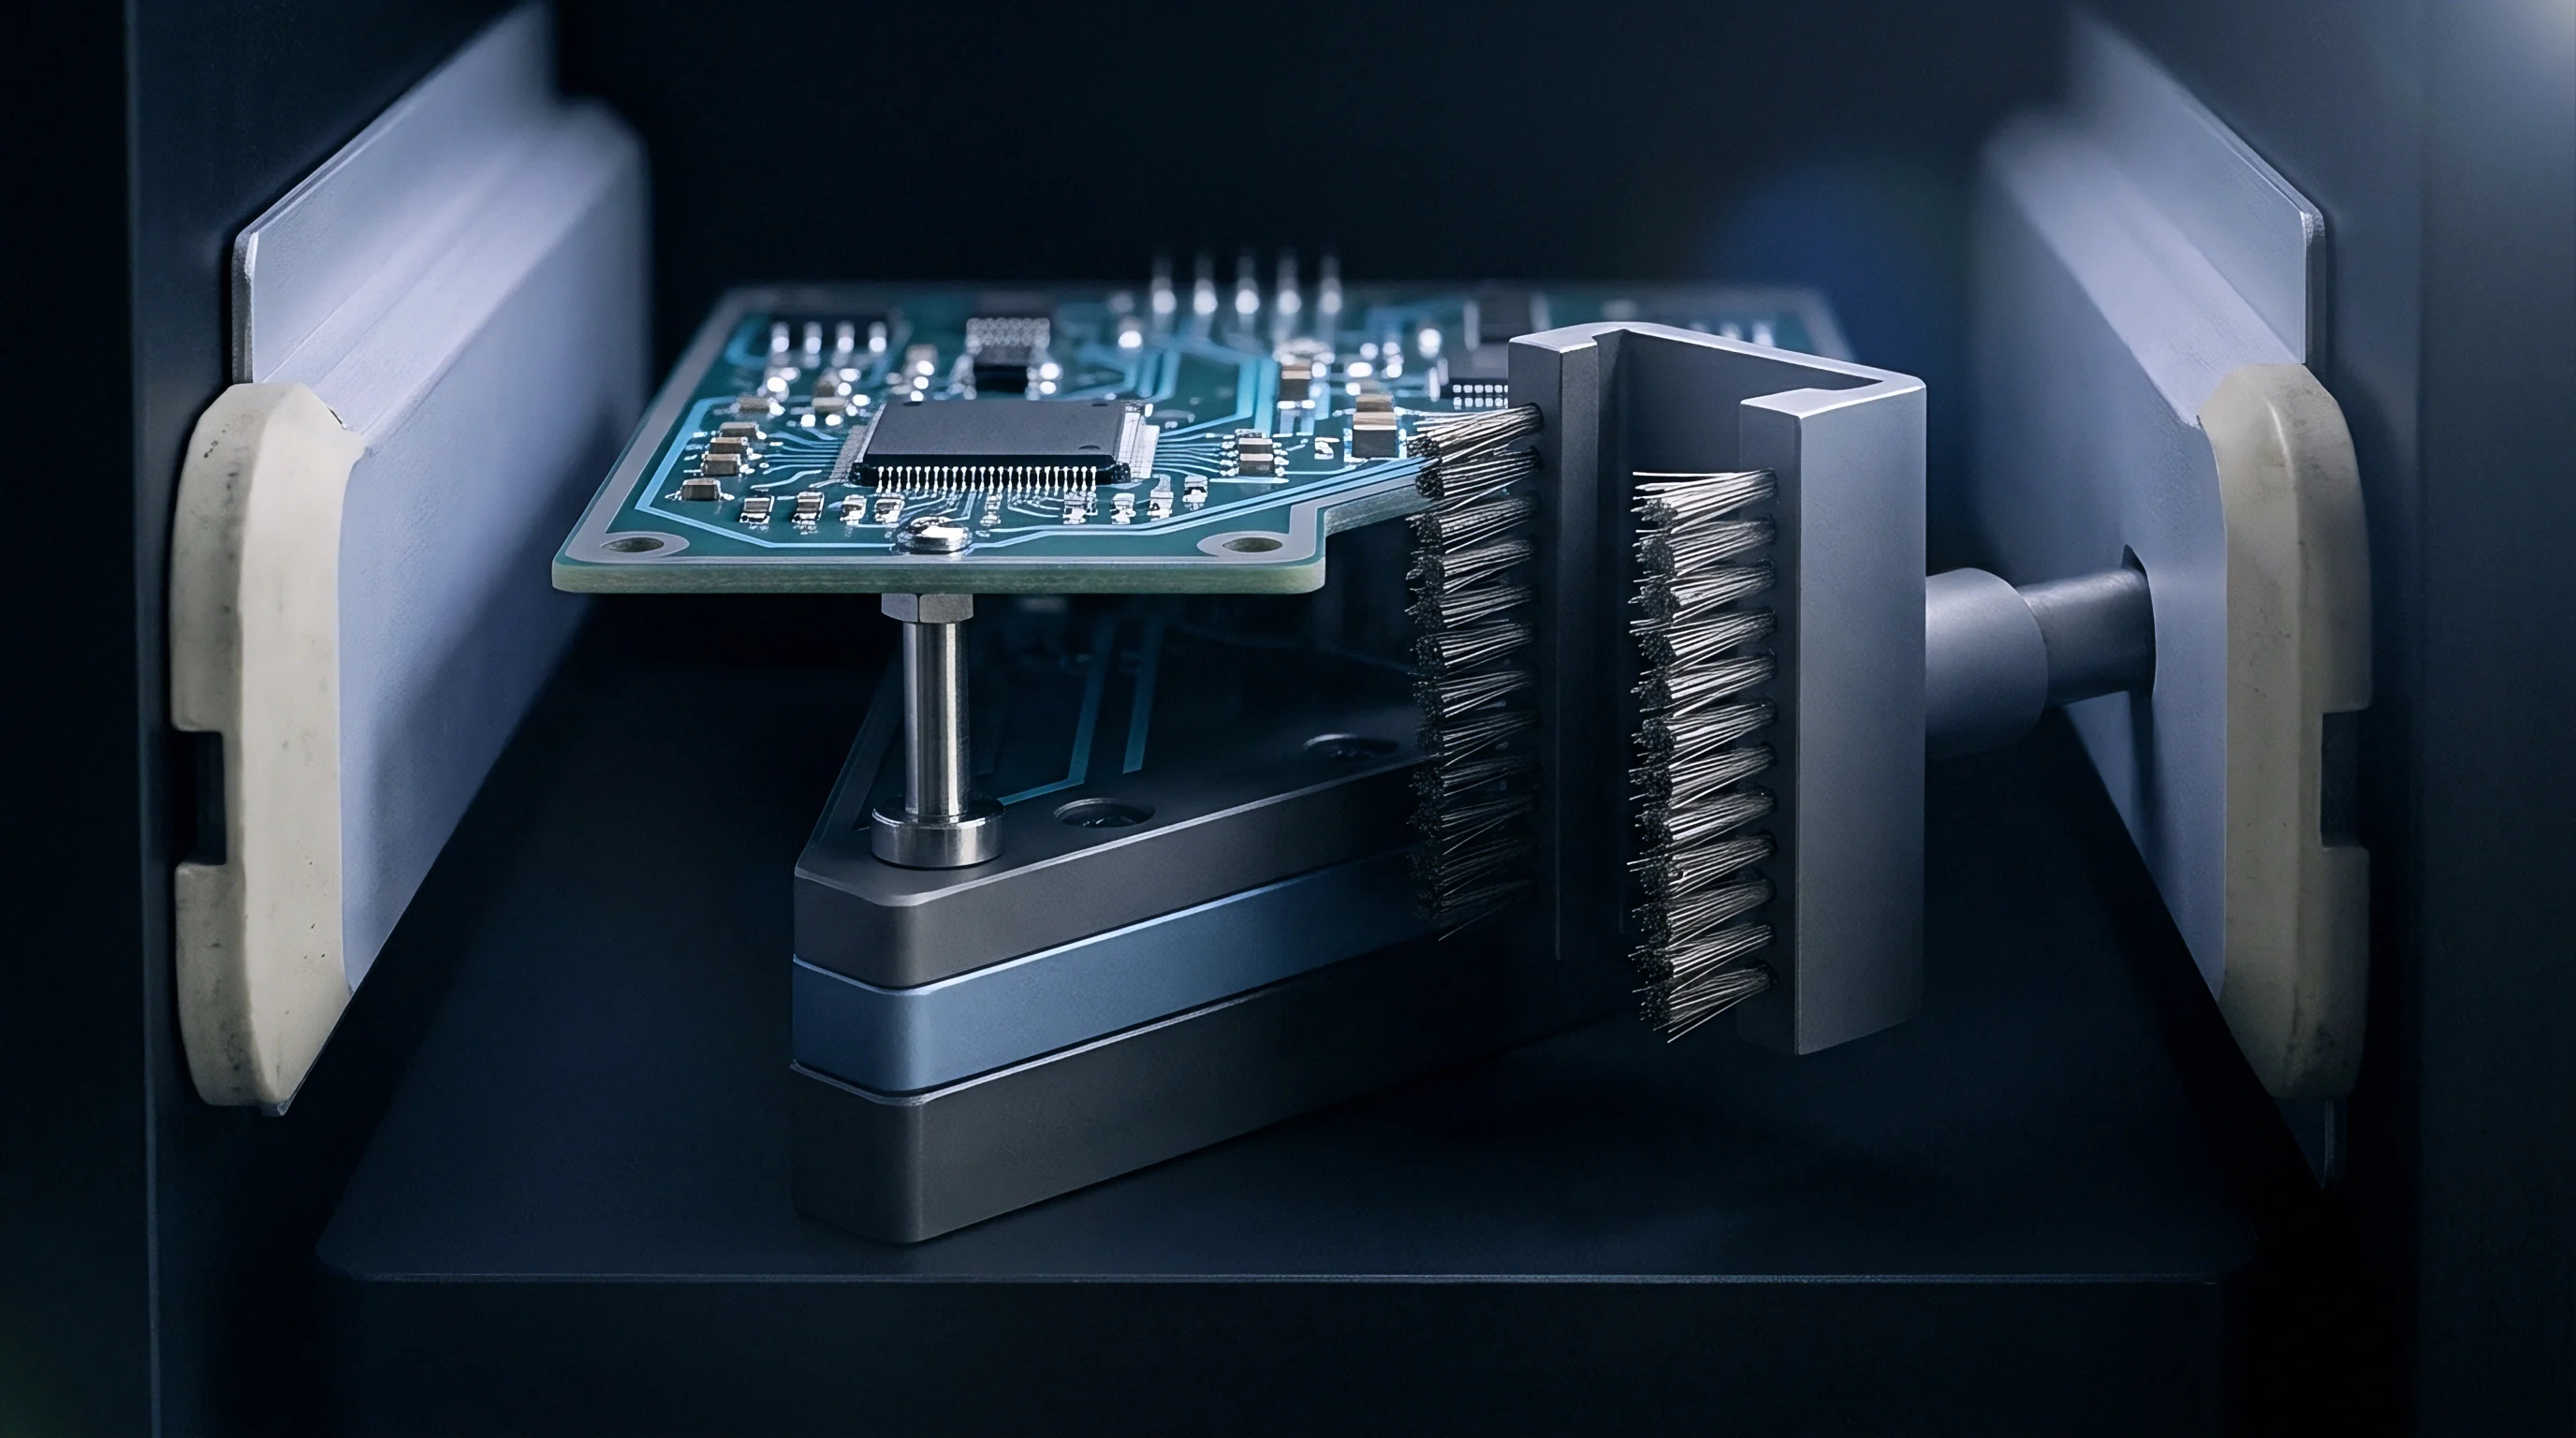
Customs technicians access test coupons located on board breakaway rails. They clamp ground-signal-ground microprobes onto exposed copper test pads without removing solder mask or conformal coating from active traces. Contact resistance, probe planarity, and hand-held probe positioning introduce measurement artifacts that drop recorded characteristic impedance below factory benchmarks.
If factory quality control released a board batch hovering at the bottom edge of the nominal tolerance window, these contact artifacts push the port measurement into illegal territory. The batch gets seized.

Dielectric
Permittivity variations govern the transmission line impedance across modern high-density interconnect laminates. Copper conductor geometry and the insulating base substrate define high-frequency impedance. Conventional board fabricators rely on the IPC-2141B standard single-frequency calculation, assuming a static relative permittivity across all operating bands.
Low-loss polyphenylene ether and modified epoxy resins do not behave statically. The real permittivity decreases systematically as frequency climbs from 100 megahertz toward 40 gigahertz.
High-frequency propagation velocity changes with substrate dielectric loss. The Djordjevic-Sarkar model accounts for this physical behavior by defining a continuous relaxation spectrum that satisfies causality through the Kramers-Kronig relations. Dielectric loss causes phase velocity to increase with frequency, while series conductor losses from skin depth attenuation reduce line velocity at lower frequencies.
The interplay between skin effect and dielectric dispersion establishes a frequency-dependent characteristic impedance profile. Single-frequency factory tests miss this profile entirely.
A low-loss polyphenylene ether laminate with a nominal dielectric constant of 3.65 at one gigahertz drops to 3.42 at twenty-eight gigahertz under dry laboratory conditions.
Conductor surface topography deepens this frequency sensitivity. At gigahertz frequencies, electrical current concentrates within a thin skin depth along the copper-dielectric interface. Standard rolled or electrodeposited copper exhibits microscopic nodules that force high-frequency currents along extended physical contours, increasing the effective line inductance and internal resistance.
Surface roughness models such as the Huray snowball model calculate the exact impedance depression caused by profile peaks and valleys. Copper roughness pulls down the high-frequency characteristic impedance by two to four ohms relative to classical smooth-conductor calculations.
High Frequency Dispersion Mechanics
Loss mechanisms alter line performance across broad spectra. Characteristic impedance is the square root of the ratio between complex series impedance and complex shunt admittance. At low frequencies, conductor resistance elevates impedance.
As frequency enters the gigahertz regime, dielectric dissipation factors dominate, driving the phase angle of the line admittance and depressing the real magnitude of impedance. Skin effect dominates above two gigahertz.
- Copper profile tooth amplitude forces high-frequency currents into elongated paths, increasing internal inductance while reducing characteristic impedance at high frequencies.
- Resin dielectric relaxation lowers base substrate permittivity across rising harmonic intervals, accelerating signal phase velocity through the core media.
- Dissipation factor elevation raises shunt conductance across high-density differential pairs, dissipating signal energy into heat along closely spaced traces.
- Weave-induced phase skew introduces localized capacitance spikes where differential pairs cross fiberglass knuckles, distorting differential impedance targets by several ohms.
Where Do Extraction Artifacts Skew Conformance?
Calibration errors at customs test stations amplify physical dispersion discrepancies. Border laboratories frequently use short-open-load-thru calibrations on planar substrates before touching raw board coupons. Substrate calibration moves the measurement reference plane to the probe tips, leaving the discontinuity of the coupon landing pad uncompensated.
The capacitive loading of an uncompensated test pad causes a local impedance dip of three to five ohms right at the measurement launch point. Line reflections distort eye height.
Fabricators often tell buyers that an outgoing coupon passing at one gigahertz guarantees line integrity across all operating frequencies regardless of test method.
Swell
Moisture absorption during international transit transforms the electrical properties of high-density circuit assemblies. Standard shipping containers experience severe environmental fluctuations during transoceanic voyages. Temperatures inside closed steel containers reach 60 degrees Celsius under tropical sun and plunge below freezing in northern ports, driving relative humidity from 20 percent to 98 percent.
Standard epoxy-glass laminates absorb atmospheric water vapour up to 0.45 percent of their total weight under sustained maritime exposure.
Water carries a relative dielectric constant of roughly 78 at room temperature, dwarfing the 3.5 relative permittivity of base laminate resin. When fiberglass-epoxy composites absorb ambient water molecules, the bulk dielectric constant climbs sharply. For every 0.1 percent increase in absorbed moisture weight, the effective dielectric constant of a standard FR-4 or modified epoxy substrate shifts upward by approximately 0.08 units.
This elevation directly depresses the characteristic impedance of every microscopic trace on the assembly. The trace impedance sags.
Dry packaging bags containing saturated desiccant release captured water vapour back into circuit assemblies when hold temperatures exceed forty degrees Celsius.
Naval radar feedline assemblies and subsea repeater driver boards experience similar moisture degradation when seals fail, exhibiting severe return loss degradation before deployment. High-density commercial assemblies face the identical physical hazard inside ocean freight containers. When moisture enters unsealed circuit packaging, the outer layers of the multilayer board absorb water first, disproportionately degrading surface microstrip traces compared to embedded striplines.
A differential microstrip channel formulated to clear factory inspection at 100 ohms lands at the customs dock measuring 93 ohms. Importers watch shipments stall because moisture altered the board physics during sea transit.
Transit Humidity Absorption Kinetics
Diffusion rates through resin matrices depend on temperature, laminate glass transition temperature, and mechanical core construction. Thinner outer dielectric layers in modern high-density designs absorb ambient moisture rapidly, reaching saturation equilibrium within seven to ten days of ocean transit. Solder mask layers absorb water even faster than structural core laminates, exhibiting moisture-induced dielectric constant increases of up to twenty percent.
Water carries high dielectric permittivity.
- Laminate moisture affinity determines the total volume of atmospheric water vapor captured within resin polar bonding sites during sustained ocean transport.
- Solder mask saturation depresses microstrip impedance by elevating local surface capacitance along exposed differential traces.
- Vapor barrier failure permits humidity infiltration through micro-punctures or compromised heat seals in vacuum shipping enclosures.
Bake out Recovery Boundaries
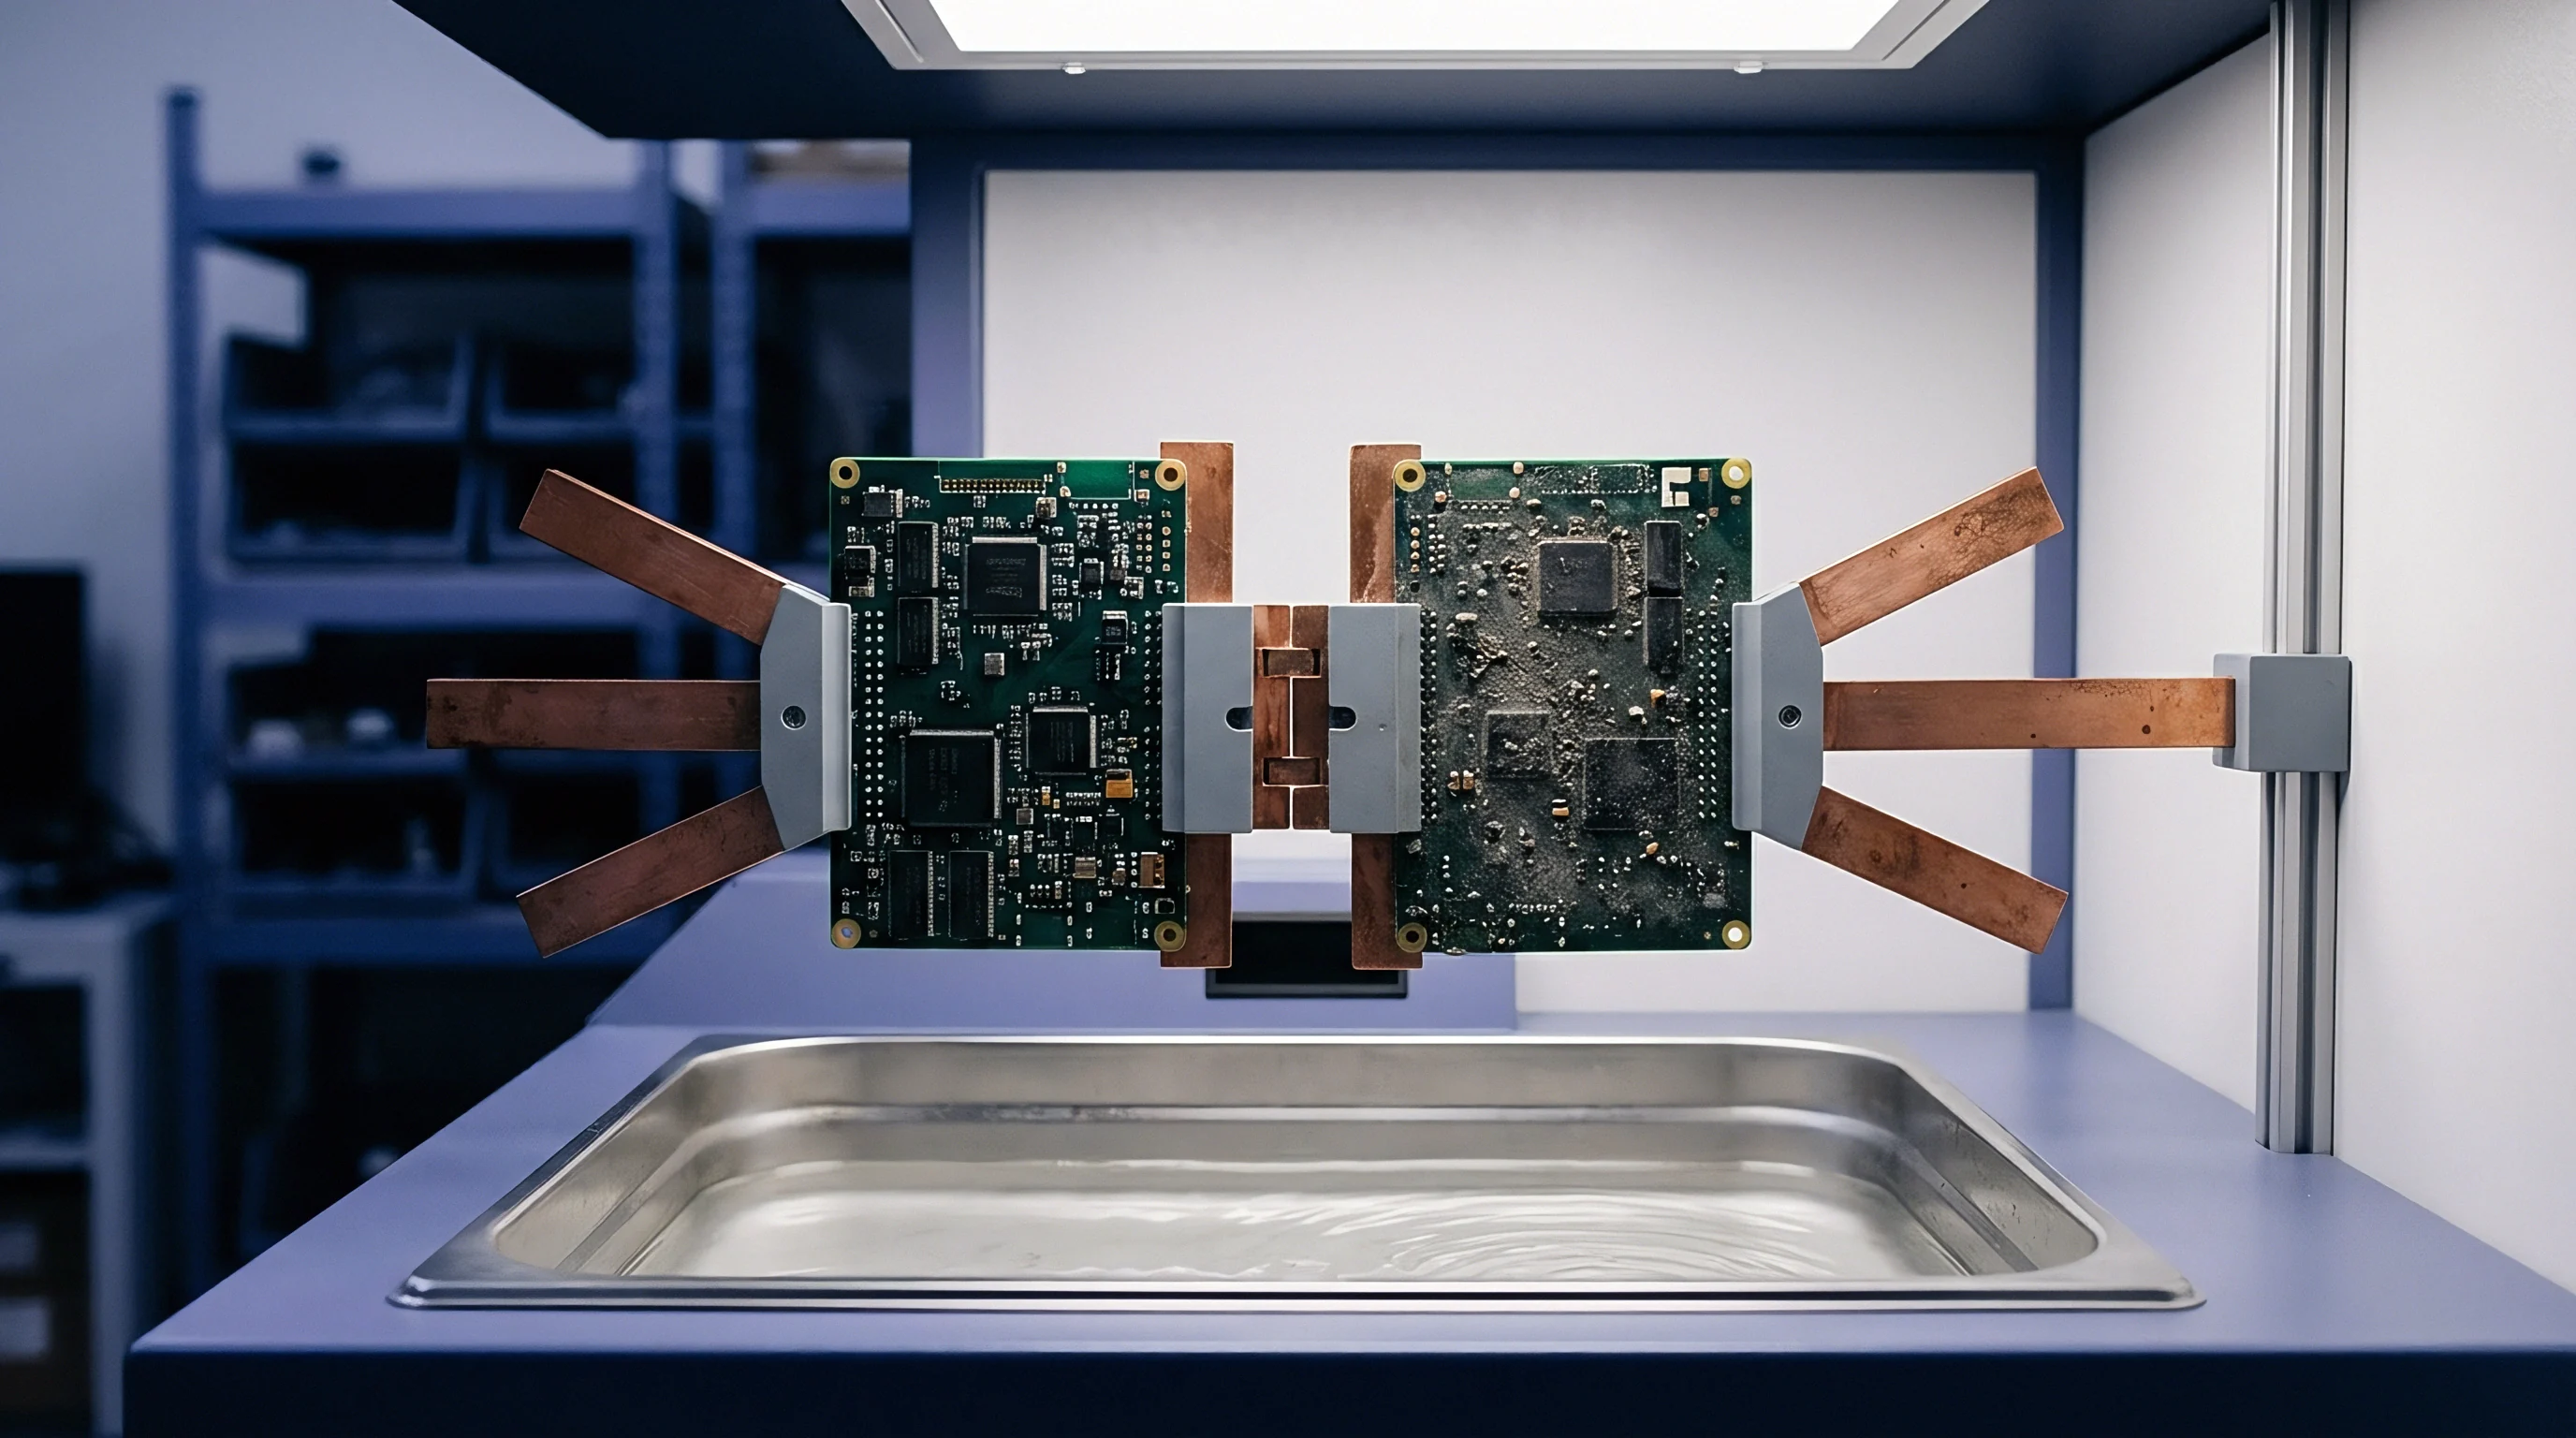
Restoring displaced impedance through thermal drying requires careful temperature profiling. Placing moisture-compromised circuit assemblies in a convection bake-out oven at 105 degrees Celsius for 24 hours drives out free water molecules and lowers the dielectric constant back toward nominal baseline values. Customs port authorities refuse to allow importers to unpack and bake seized goods prior to compliance testing.
The official enforcement measurement captures the assembly in its wet arrival state. What lands at the port determines compliance.

Derivation
Calculating protective guardbands demands a rigorous statistical budget that accounts for production tolerances, measurement system uncertainty, and environmental transit drift. The factory outgoing test window cannot match the nominal specification window defined in the customer drawing. If a procurement contract specifies a differential impedance of 100 ohms with a bilateral tolerance of plus or minus ten percent, the total allowable band spans 90 to 110 ohms.
Releasing boards that measure 91 ohms at the factory gate guarantees a customs failure whenever environmental swelling and vector network analyzer discrepancies conspire to deduct two or three ohms at the port of entry.
Establishing the root-sum-square guardband requires quantifying five independent variance components. These variables represent factory measurement uncertainty, customs laboratory measurement uncertainty, ambient temperature variation, maritime moisture absorption, and frequency-dependent dielectric dispersion between factory test benches and border inspection stations. Etch variation adds two ohms.
Root Sum Square Guardband Formulation
Let Z_nom represent the nominal characteristic impedance specified on the procurement engineering drawing, and let delta_Z_spec represent the maximum allowable customer specification limit. The effective factory upper and lower guardband acceptance limits, Z_upper and Z_lower, are formulated by subtracting the total expanded uncertainty, U_total, from the nominal tolerance boundary:
U_total = k sqrt( u_factory^2 + u_customs^2 + u_temp^2 + u_moisture^2 + u_dispersion^2 )
The coverage factor k equals 2, defining a 95.4 percent confidence interval under Gaussian distribution assumptions. Component u_factory accounts for the standard uncertainty of the factory test bench, including time-domain reflectometer pulse jitter, probe head positioning repeatability, and coupon trace launch discontinuities. Component u_customs captures the known measurement uncertainty floor of customs vector network analyzers, encompassing microprobe contact variations and calibration residual errors.
Component u_temp models the thermal coefficient of dielectric constant across the operating spread between factory room temperature at 23 degrees Celsius and dock inspection temperatures reaching 35 degrees Celsius. Component u_moisture quantifies the downward impedance shift caused by maximum anticipated container relative humidity. Component u_dispersion represents the deterministic downward shift in impedance from the factory test frequency to the customs regulatory audit frequency.
- Quantify individual standard uncertainties across laboratory instrumentation, environmental drift, and dispersion mechanics.
- Calculate the combined standard uncertainty using root-sum-square summation across all uncorrelated variance terms.
- Multiply the combined uncertainty by the coverage factor of two to establish the expanded guardband margin.
- Subtract the expanded margin from drawing limits to establish the internal factory quality pass threshold.
Worked Budget for High Speed Pairs
Take an enterprise computing mainboard featuring 100-ohm nominal differential microstrip pairs running PCIe Gen 5 protocols. The target specification allows plus or minus ten ohms, setting the statutory customs compliance range between 90 ohms and 110 ohms. The factory inspects breakaway test coupons at one gigahertz using a calibrated time-domain reflectometer.
The customs border laboratory inspects identical coupons at sixteen gigahertz using a vector network analyzer equipped with ground-signal-signal-ground microprobes. Money moves on these numbers, because a two-ohm discrepancy at port inspection converts profitable production batches into confiscated collateral.
| Uncertainty Parameter | Distribution | Variance Contributor | Standard Uncertainty (Ohms) | Frequency Sensitivity |
|---|---|---|---|---|
| Factory Bench Repeatability (u_factory) | Normal | TDR calibration, probe contact | 0.45 | Invariant (1 GHz fixed) |
| Customs Laboratory VNA (u_customs) | Normal | Port calibration, probe parasitics | 0.85 | Elevates with frequency |
| Thermal Drift (u_temp) | Rectangular | Delta T = 12 deg C, TcEr = -150 ppm/C | 0.32 | Substrate specific |
| Transit Moisture Uptake (u_moisture) | Rectangular | RH shift 45% to 90%, Dk shift +0.22 | 1.45 | Dominates lower bounds |
| High-Frequency Dispersion (u_dispersion) | Deterministic | 1 GHz TDR to 16 GHz VNA shift | 1.60 | Djordjevic-Sarkar model |
| Values based on IPC-TM-650 2.5.5.7 strip-line test methods applied to low-loss modified epoxy substrates at 23 degrees Celsius baseline. | ||||
The standard uncertainty components yield a combined standard uncertainty: sqrt(0.45^2 + 0.85^2 + 0.32^2 + 1.45^2 + 1.60^2) = sqrt(0.2025 + 0.7225 + 0.1024 + 2.1025 + 2.5600) = sqrt(5.69) = 2.39 ohms. Applying a coverage factor of k = 2 produces an expanded total guardband U_total of 4.78 ohms.
Because moisture absorption and dielectric dispersion act unidirectionally to depress characteristic impedance, the lower factory guardband requires asymmetric allocation. The deterministic 1.60-ohm downward shift from high-frequency dispersion and the 1.45-ohm moisture depression drag impedance lower. A factory unit measuring 92 ohms at one gigahertz lands at the customs dock measuring 87 ohms at sixteen gigahertz under saturated humidity.
The lower guardband threshold must sit at 94.8 ohms instead of 90.0 ohms. Customs labs enforce tighter bands. Releasing a board below 95 ohms at the factory gate guarantees a border violation whenever environmental conditions saturate the shipping packaging.
Arbitration
Reconciling measurement discrepancies between factory automated benches and customs testing facilities requires an agreed protocol for de-embedding fixture parasitics. Customs enforcement agents do not dismantle production hardware to access inner stripline routing. They apply high-frequency microprobes directly to surface test structures or edge breakaway coupons.
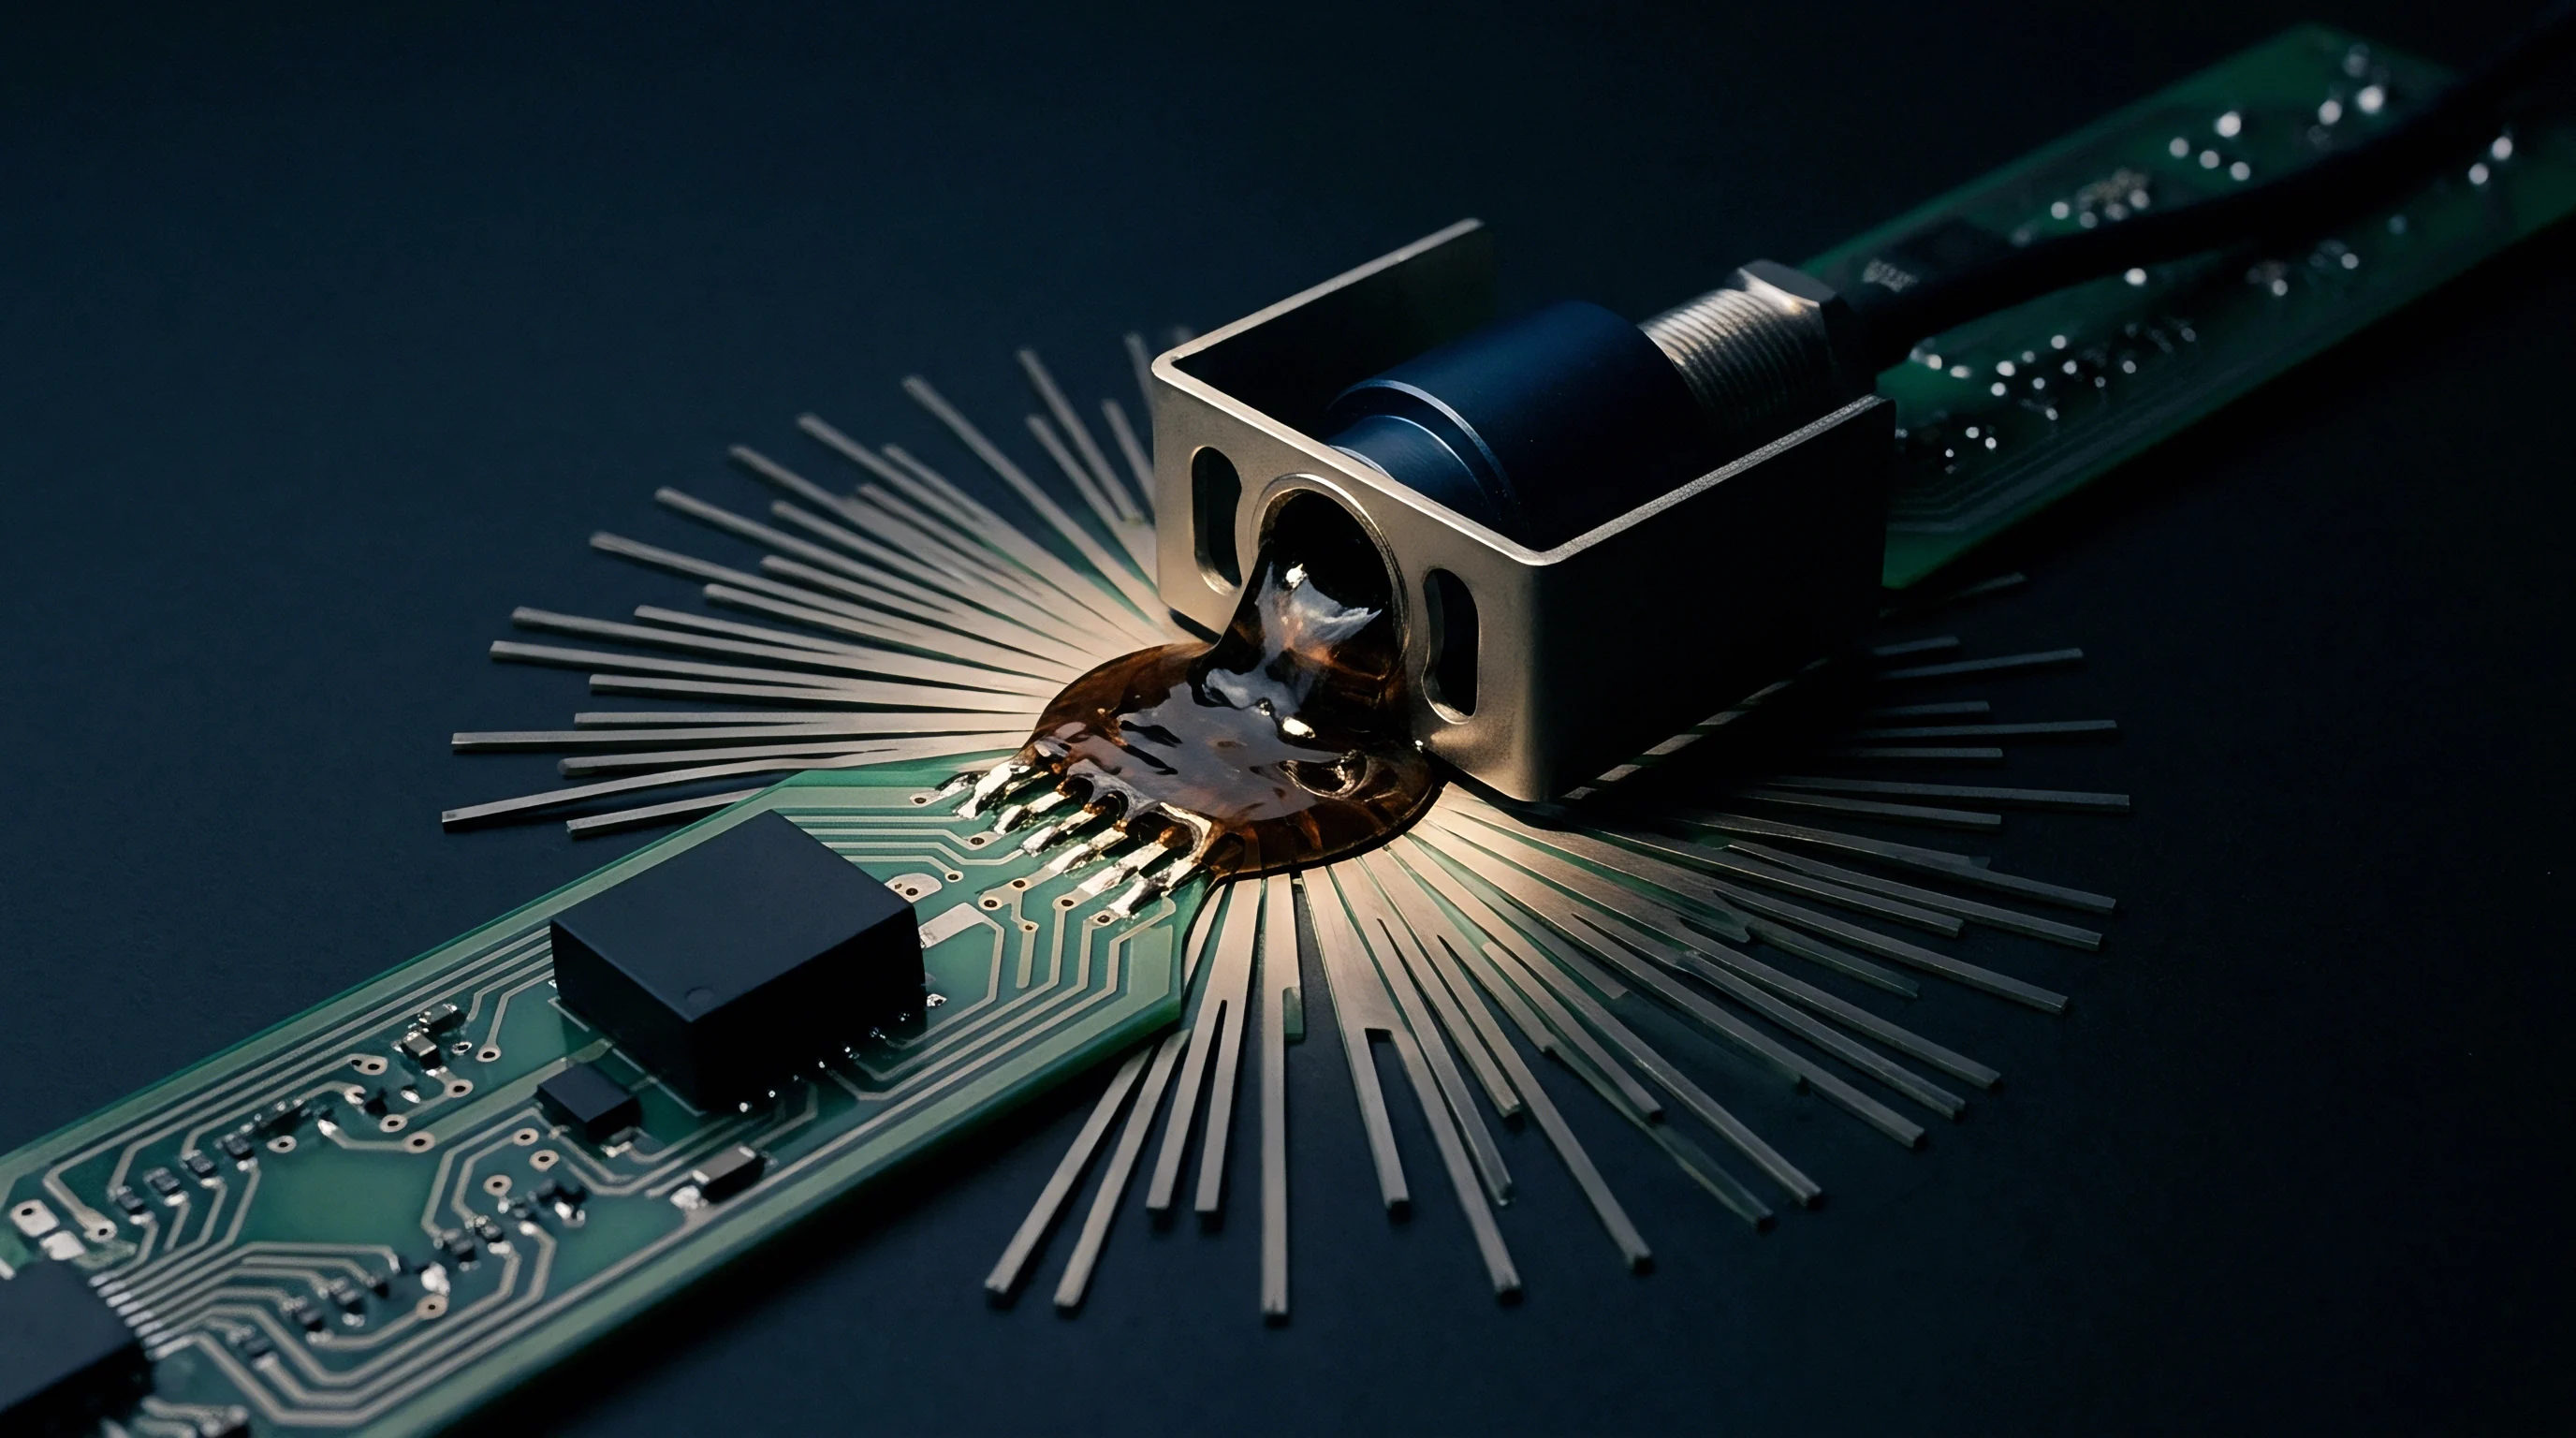
Solder pad capacitance, probe tip ground loop inductance, and coupon launch traces add parasitic reactive components that distort true trace impedance profiles. Establishing standard de-embedding protocols removes these launch artifacts before an official non-compliance citation gets issued.
The IEEE 370 standard governs electrical characterization of printed circuit board test fixtures up to 50 gigahertz. It specifies two primary de-embedding workflows: the 2x-thru method and the 1x-reflect method. The 2x-thru technique requires a dedicated coupon structure representing double the launch trace length, allowing mathematical extraction and subtraction of the s-parameters representing the probe pads and lead-in traces.
When customs laboratories fail to run full IEEE 370 de-embedding, they register the raw probe pad capacitance as part of the transmission line, reporting false negative impedance deviations of up to six percent.
Customs laboratory technicians utilize non-destructive time-domain reflectometry gating to isolate coupon launch reflections from central trace transmission sections.
Vector network analyzer calibration establishes the absolute baseline for all border arbitration actions. Electronic calibration modules automate vector error correction, but remain vulnerable to cable flexure, connector torque variance, and ambient thermal drift. Table 2 details calibration regimes and their associated measurement discrepancy limits across cross-border laboratories.
| Verification Method | Instrumentation | Calibration Standard | Pad De-Embedding | Discrepancy Band |
|---|---|---|---|---|
| Factory Production Gate | Sampling TDR (20 ps rise) | Short-Load Standard | None (Raw windowing) | +/- 1.8 Ohms |
| Customs Primary Screen | Handheld TDR (35 ps rise) | Internal Factory Cal | None | +/- 4.2 Ohms |
| Customs Formal Audit | 4-Port VNA (40 GHz) | SOLT Planar Substrate | Time-Domain Gating | +/- 2.1 Ohms |
| Joint Legal Re-Test | 4-Port VNA (50 GHz) | TRL On-Wafer / Coupon | IEEE 370 2x-Thru | +/- 0.7 Ohms |
Vector Network Analyzer Fixture Deembedding
Mathematical de-embedding strips away the transfer matrix of the test fixture to reveal the intrinsic transmission characteristics of the board assembly under audit. When customs agents run frequency sweeps up to 28 gigahertz without mathematical de-embedding, coupon launch return loss degrades beyond fifteen decibels. This parasitic attenuation corrupts the calculated impedance profile.
Demanding an IEEE 370 2x-thru verification forces border testing facilities to subtract test fixture launch discontinuities from the final legal measurement ledger. Margins evaporate under cross-border scrutiny.

Is Vector Calibrated Shunt Correction Defensible?
Importers challenge customs laboratory findings by examining the calibration substrate history and probe wear logs. Customs laboratories rarely publish their exact calibration substrate drift records or microprobe contact inductance data, which fluctuates between 40 and 120 picohenries under manual probing. A prudent buyer treats this worst-case contact inductance offset as an immediate subtraction from the allowable factory operating window.
When an official detention occurs, requesting raw scattering-parameter touchstone files allows private re-evaluation using calibrated line-reflect-match algorithms.
Section 10.4 of IPC-TM-650 Method 2.5.5.7 provides that in disputes over coupon impedance compliance, vector network analyzer s-parameter measurements processed through validated de-embedding algorithms supersede raw time-domain reflectometry traces.
Tariff
Impedance non-compliance at customs checkpoints unleashes immediate commercial fallout that extends far beyond technical engineering adjustments. When border inspectors determine that imported assemblies fail declared electrical criteria, customs authorities reject the declared customs entry. Border enforcement officers reclassify shipments under alternate tariff subheadings or issue notices of redelivery under commercial customs bonds.
If an importer declares an assembly under an automated data processing heading carrying zero duty, and customs testing asserts non-compliance with the stated interface speed, agents reclassify the cargo under general electronic apparatus categories bearing tariffs between 2.5 percent and 15 percent.
Financial exposure mounts rapidly during formal detention proceedings. Importers pay demurrage fees ranging from 150 to 500 dollars per container per day while cargo sits under customs hold in bonded port yards. If goods cannot be brought into verified compliance or successfully arbitrated through technical re-testing, customs authorities demand exportation or destruction under port supervision.
Bonded storage drains operating cash.
Customs Reclassification and Commercial Penalties
Administrative penalties under 19 U.S.C. 1592 penalize importers for material false statements resulting from specification discrepancies. For negligent non-compliance, penalties reach the lesser of the domestic value of the merchandise or twice the total loss of duties. Gross negligence elevates penalties to four times the lost duty or forty percent of the dutiable value.
Even when an assembly carries a nominal duty rate of zero percent, customs authorities assess clerical penalties based on merchandise value if documentation asserts compliance with specific technical interface standards that physical testing disproves. The container seal stays intact.
Bonded Warehouse Retention Economics
Managing detained goods requires moving cargo from ocean terminal yards to bonded storage facilities to halt container demurrage penalties. Transferring cargo, maintaining customs custodial bonds, and retaining independent test laboratories consumes ten to thirty thousand dollars per detained lot before technical arbitration begins. Disputes drag through administrative tribunals.
Re-testing fees for multi-port vector network analyzer characterization by accredited ISO/IEC 17025 facilities exceed two thousand dollars per sample set.
Whether customs administrations will eventually formalize standard temperature and humidity normalization protocols before taking mandatory enforcement measurements on hydroscopic high-density laminates remains an open operational question.